The Reports & Graphs window allows you to run reports that analyze every detail of your business, including utilization, revenue, commissions, payroll, and even specific metrics needed for reviews and evaluations.
You can access the Reports & Graphs window by clicking ![]() on the toolbar.
on the toolbar.
Tip: Click here for instructions on how to run a report.
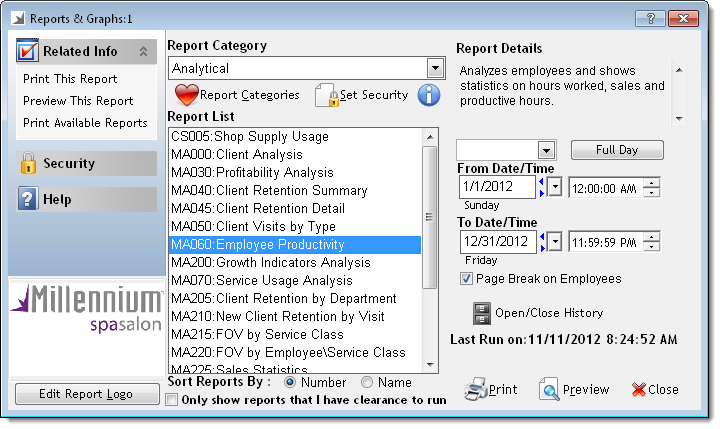
Following are descriptions of the features on the Reports & Graphs window.
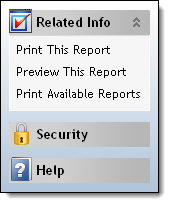
The Related Info panel features links that allow you to print and display a print preview of the report currently selected. Click the Security link to view the users that have access to run the report currently selected. Click the Help link to view the Reports User Guide.
The Report Logo section displays a preview of the logo that prints in the top right corner of each report.
![]()
The Paint application opens with the current report logo.
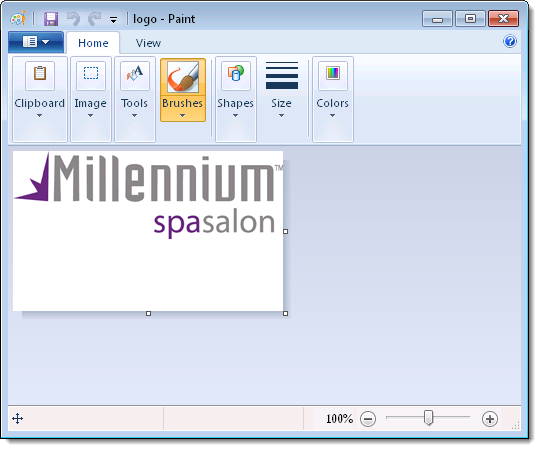
Important: The report logo fits into a predetermined box in the upper right corner of each report and if you are trying to use a larger image this may cause distortion of the logo. Therefore, you may have to experiment with different image sizes and the amount of white space around the image to make the logo display correctly.
Millennium classifies reports into categories that relate to their content and usage.
Example: The Analytical category features reports that evaluate the performance of employees and the business as a whole. The Register category features reports that analyze transactions processed through the Register.
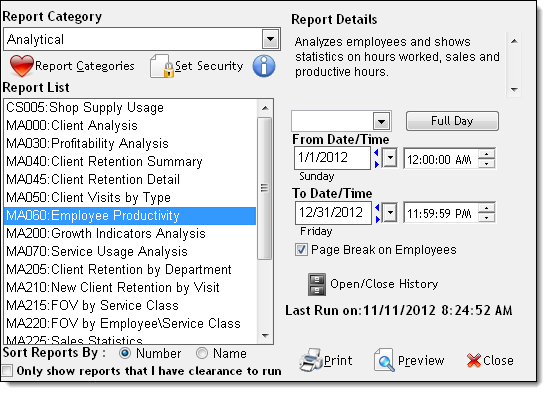
The selection in the Report Category field controls the list of reports that display in the Report List.
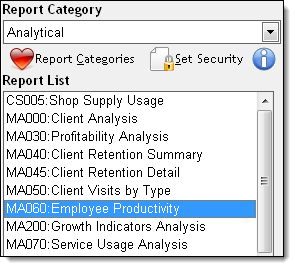
The Report List displays the reports assigned to the category selected in the Report Category field. Once you select a report in the Report List, the description and display options for the report display on the right side of the window.
Example: The following example shows the description and display options for the MA060: Employee Productivity report.
Notes:
If you do not have security access to run a report, the report displays in gray text and you cannot select it. You can hide the reports that you do not have access to run by selecting Only show reports that I have clearance to run.
More Info: You can control employee access to reports using the Security Administration window. Click here for instructions.
The Report Details section displays the contents of the selected report.
The Display Options section features options to select the data and layout for a report.
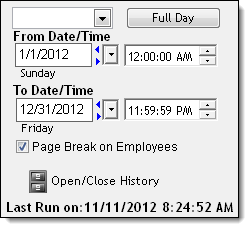
In the example above, the From Date/Time and To Date/Time fields allow you to select dates and times for which to view data. The Page Break on Employees option allows you to display the totals for each employee on a separate page.
Tip: The date and time when the report was last processed displays in the Last Run on field for reference.
The action buttons on the Reports & Graphs window allow you to run reports and access report utilities.
|
Button |
Description |
|
Report Categories |
Click to display the Custom Report Categories window where you can define personalized report categories featuring your favorite reports. More Info: Click here for instructions on how to define a custom report category. |
|
Set Security |
Click to display the Security Administration window where you can view the users that have access to run the report currently selected in the Report List. Important: The Set Security button is only available to employees belonging to a security group permitted to view the Security Administration window. |
|
Open/Close History |
Click to display the Open/Close History window where you can view details of Register openings and closings. |
|
|
Click to print the report currently selected in the Report List without displaying a print preview. Depending on the report selected, you may need to select additional display options before the report prints. |
|
Preview |
Click to display a print preview of the report currently selected in the Report List. Depending on the report selected, you may need to select additional display options before the print preview displays. |
|
Close |
Click to close the Reports & Graphs window without printing a report. |
related links
© 2017 Millennium by Millennium Systems International. All rights reserved.

