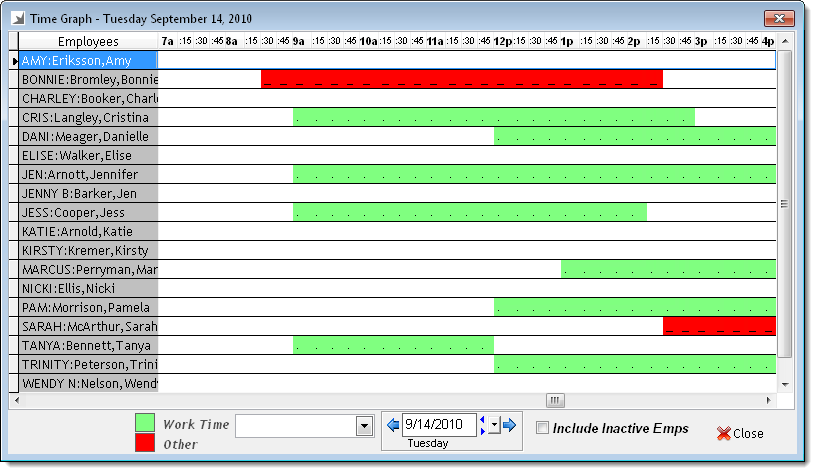
The Time Graph window displays a graph of the employees scheduled to work on a specific day. This helps you determine whether you have enough employees scheduled to cope with demand.
You can access the Time Graph window by selecting Schedules > Graphical Schedules.
Notes:
No highlight = The employee is not scheduled to work on the selected date.
Green highlight = Time the employee is scheduled for a work activity that has Show as Work Time selected, such as "Work Time".
Red highlight = Time the employee is scheduled for a work activity that does not have Show as Work Time selected, such as "Vacation".